King Gas

When comparing US primary energy production from shale, dry gas production from shale beats every category.
About 54% of 2024 US primary energy production comes from shale; 74% from oil, gas and NGLs; 84% from fossil fuels and 96% from reliables.
What many people in our industry do not realize is that our efforts in drilling and frac'ing unlock volumes of natural gas with a much higher energy content than the volumes of oil we produce. Natural gas comprises 38% of all our primary energy; oil is at 27% and coal has slid to 10%.
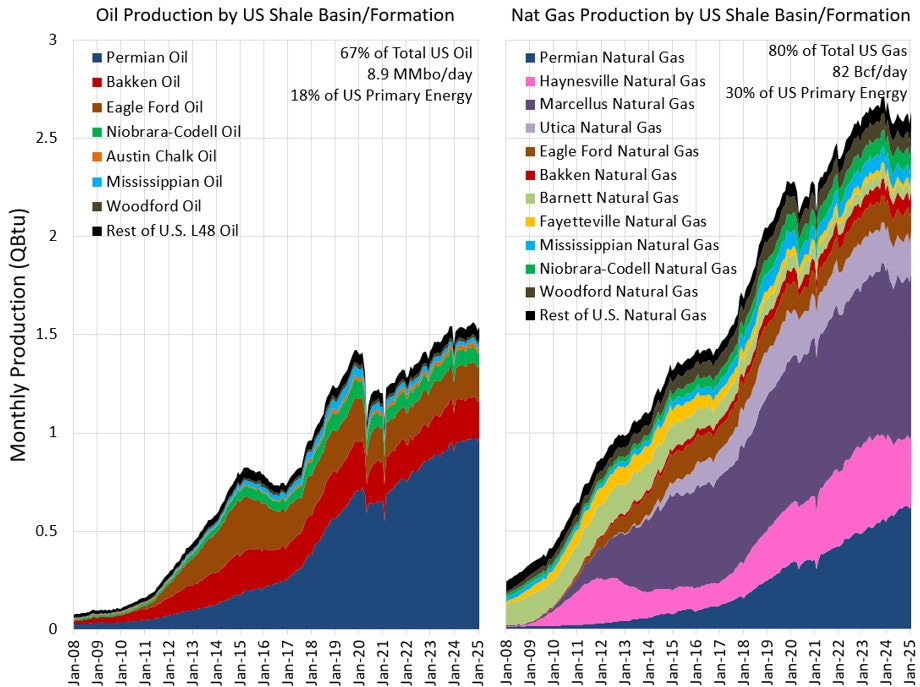
As you can see below, in shale it is even more lopsided. I have plotted both shale oil and shale gas production on the same vertical scale of Quads – Quadrillion British thermal units (QBtu), in this case produced per month. For reference, the US produced about 103 Quads in 2024, or about 9 Quads every month.
We put so much more effort in producing oil, because it is a more valuable resource, especially due to its unique benefit of transportability. But the additional and sometimes accidental production of natural gas is an incredible energy bonus that have resulted in a decoupling of oil and gas prices in the US since the beginning of the Shale Revolution. That has been a boon to consumers and has displaced King Coal, resulting in a ~15% US emissions reduction of CO2 since the beginning of the Shale Revolution.
Natural gas from the Permian, the Haynesville and the Marcellus beats the energy production from all oil in liquid rich basins.
Looks like the US is ruled by King Gas.