

Frac Fleet Throughput

In the American Shale industry, throughout rules. While we may measure frac fleet performance in different ways, the only way forward is to work more, and cram more into the time you work.
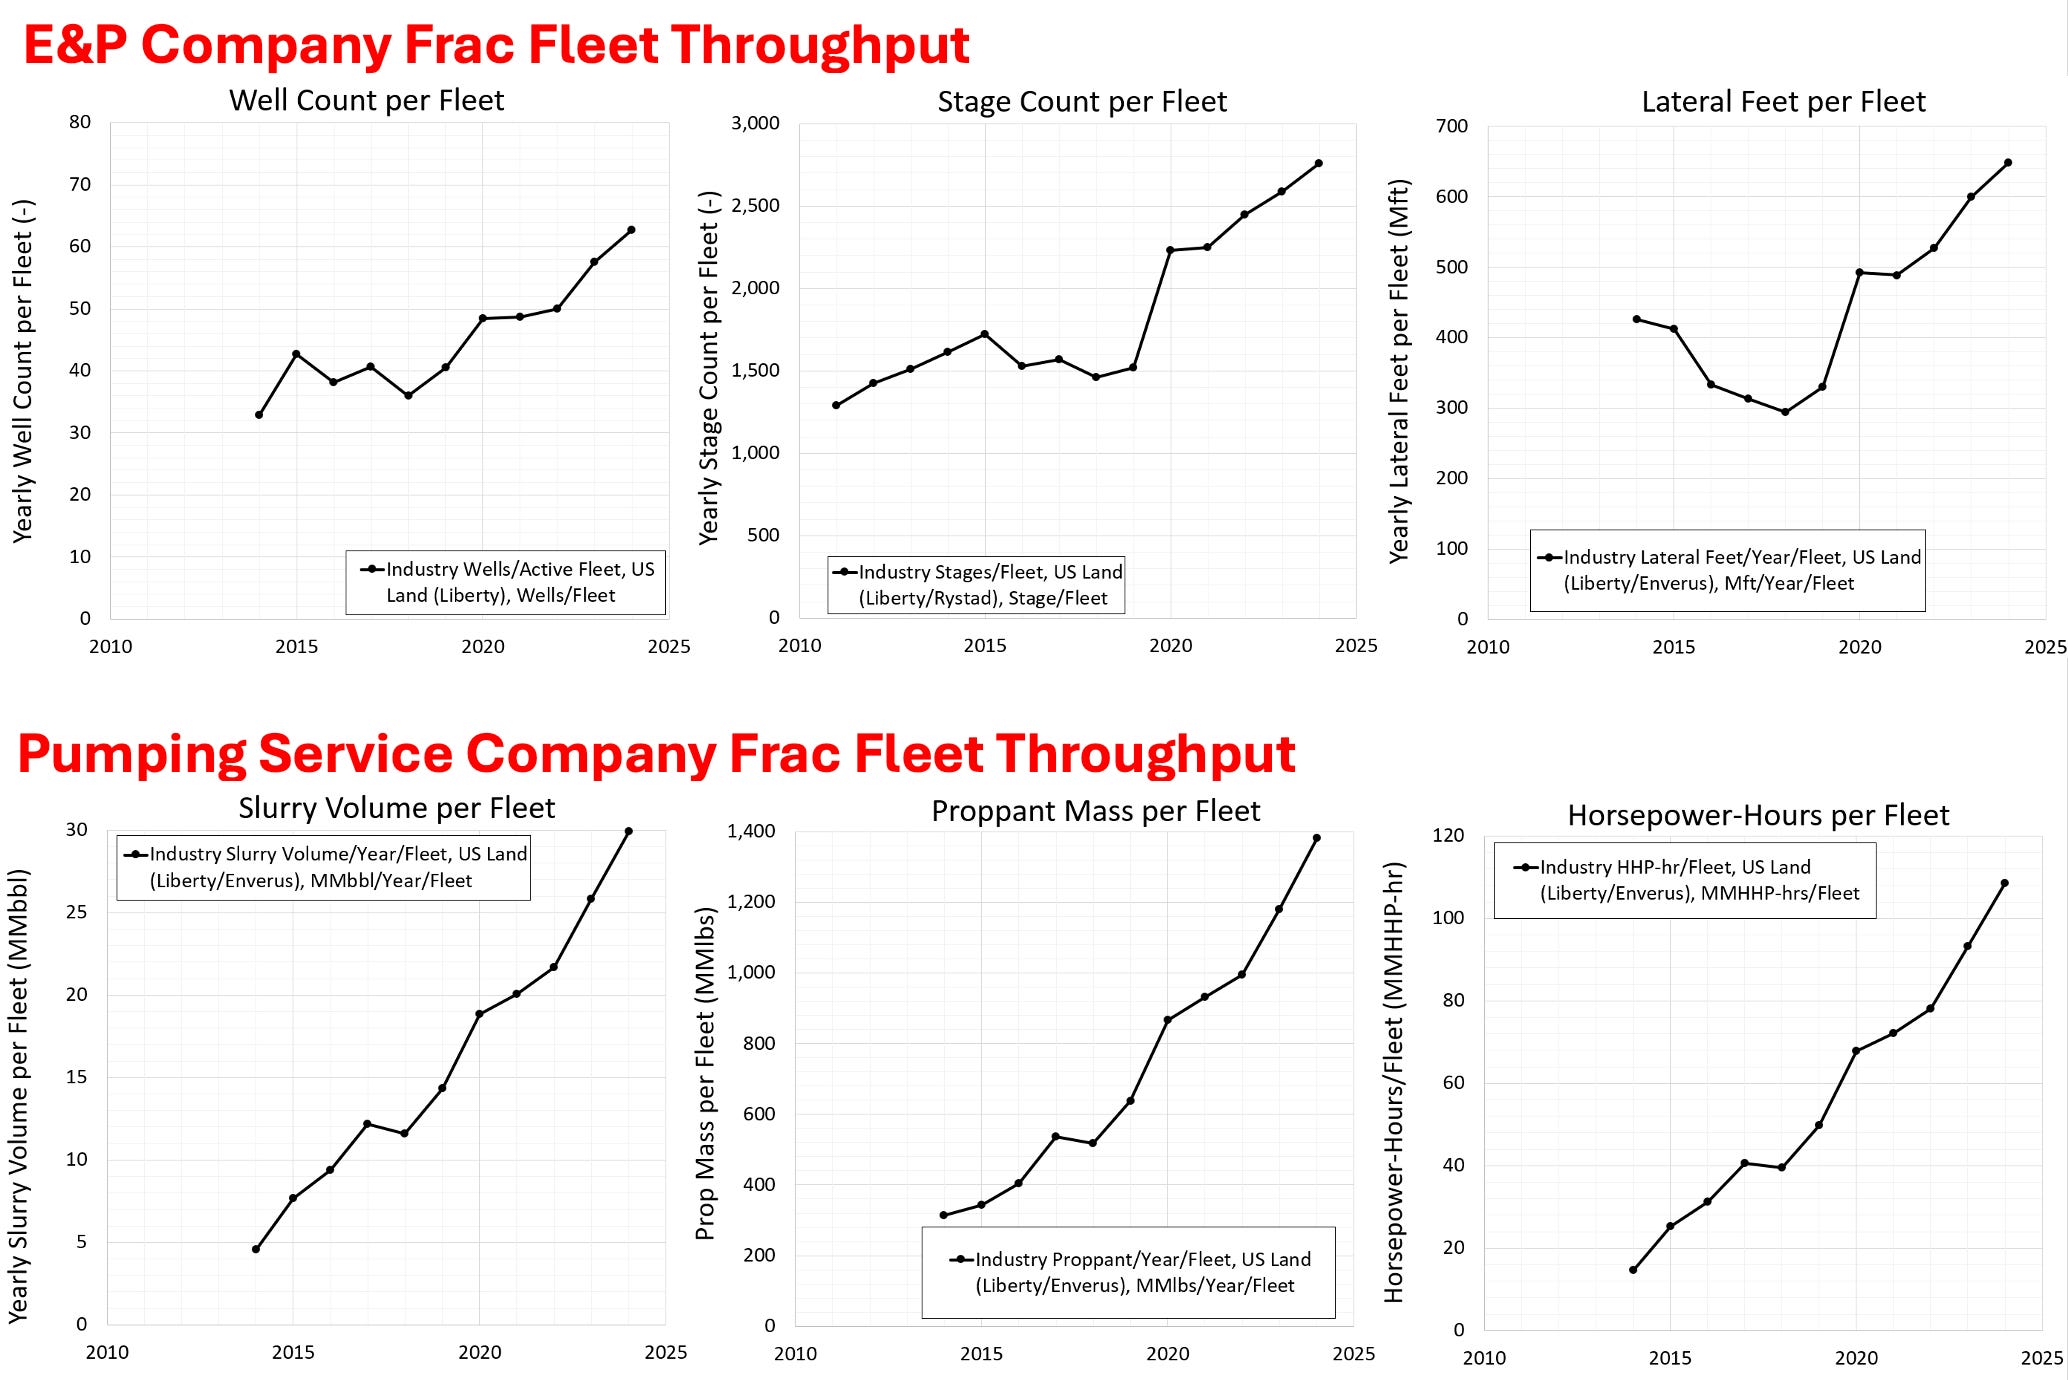
Exploration and production companies may focus their yearly (dedicated) fleet program on the number of wells brought onto production, the number of stages completed, or, a popular metric for them, lateral feet completed.
If you look at the top line of the graphs below, progress has not been uniform, as over time, a well has not been a well, a stage has not been a stage, and a lateral foot has not been a lateral foot. While well count is up about 50%, a lot more material is pumped into that well - something that is hidden in these top metrics.
These industry metrics for all US horizontal shale wells come from Liberty’s FracTrends database, which were then divided by the yearly average fleet count collected by Liberty’s Intelligence, led by Adam Bell and provided by John Phipps.
We can also calculate throughput from a big-picture pumping service company perspective. The multiplication of average rate and hours pumped gives you total volume. And with proppant concentrations fairly flat at 1.1 pounds of sand per average gallon pumped, proppant mass pumped in a year correlates with that multiplication, too. Multiplication of pressure, rate and time represents horsepower-hours. That represents work done, which is up 7x over a decade.
The industry is already pumping well over 50% of all available hours through 2024, and while I believe pumping efficiency will grow through bigger pads and fewer moves, at some point this curve will flatten. My expectation is that the biggest lever for future industry throughput changes will be in rate - through simulfrac- and trimulfrac’ing.
What do you think will be the biggest lever for throughout improvements?
Efficiencies and technology advancement are the crowned princes of capital formation, as you know Leen.
Liberty has always been scrupulous with its information.