


The American energy production pie has been growing steadily over the last two decades with a rapid transition to shale-based resources.
While US overall energy production has experienced a decade with a compounded annual growth rate (CAGR) of 2.8%, oil (6.5% CAGR), natural gas (4.4% CAGR) and NGLs (9.4% CAGR) have all grown significantly faster.
This is mostly because shale resources save Americans hundred of $billions every year - abundance through shale has lowered energy cost. Since US shale oil scaled around 2015, WTI prices are on average about $20 lower than the previous decade. For natural gas, the shale revolution started to scale around 2010, and average Henry Hub natural gas prices have roughly been cut from ~$5/MMBtu to $3/MMBtu. It is just very hard to beat the benefits of a bottoms-up market mechanism with top-down subsidies.
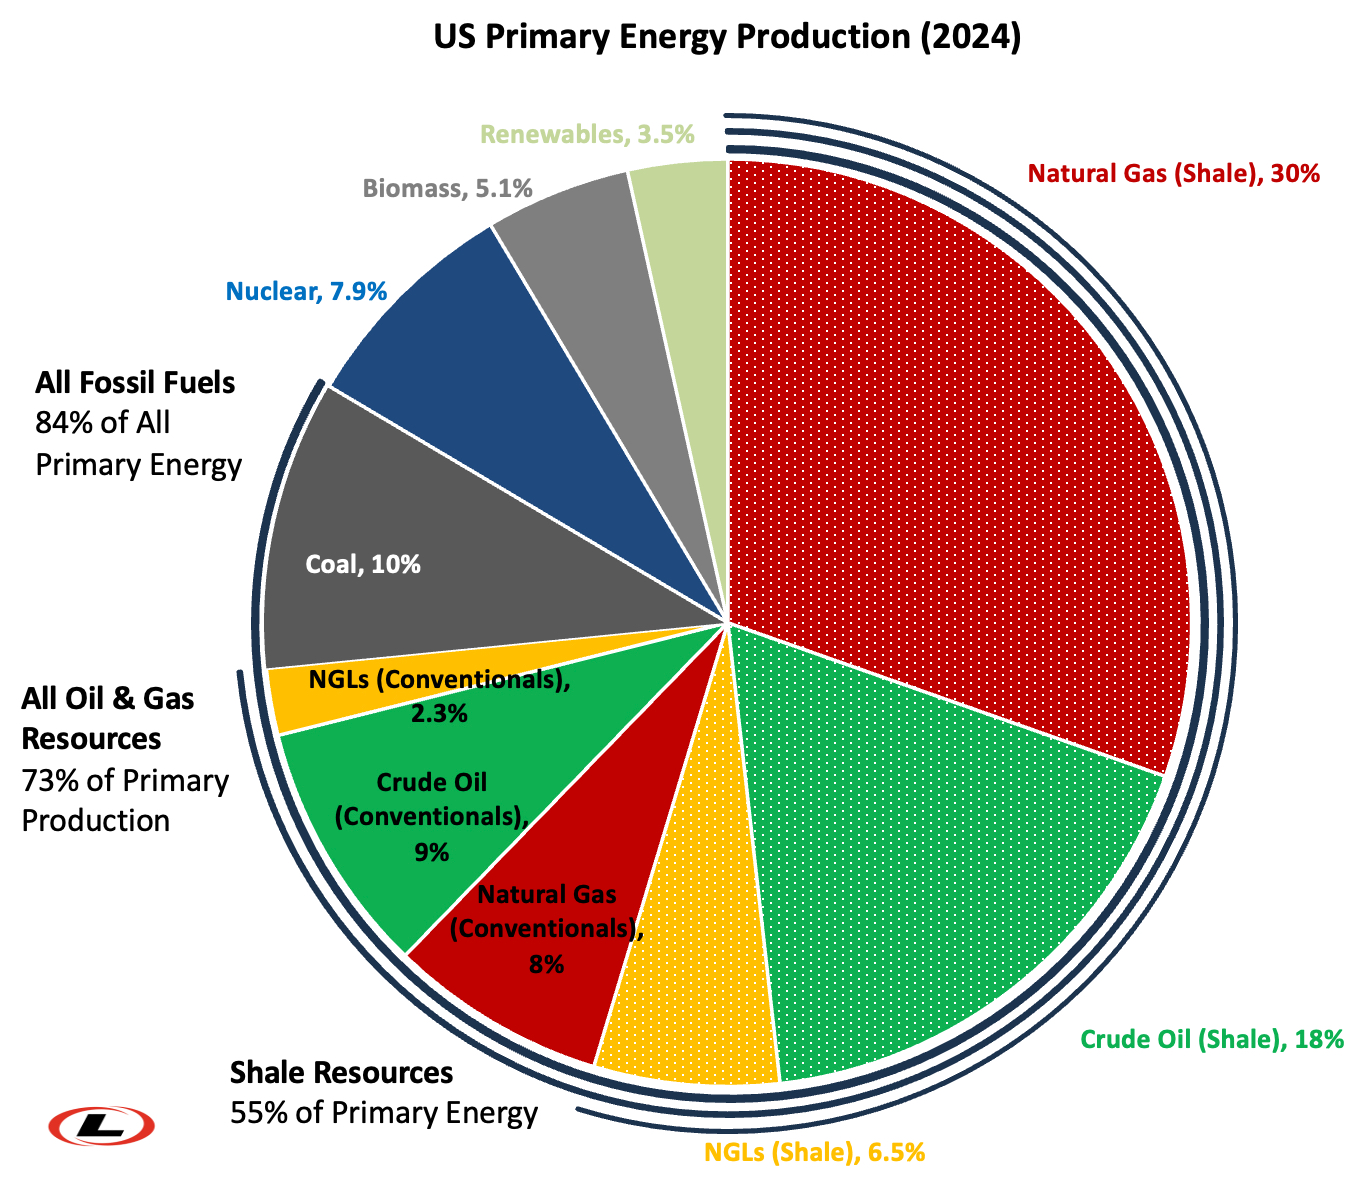
Currently all energy production by Americans are about 84% from fossil fuels; oil and gas from all resources account for 73% of the whole; and, more than half - 55% of it - comes from drilling and multi-stage frac’ing in shale.
Energy production is as American as apple pie. For many of the American dads working in the oil fields from North Dakota to Texas on their Father’s Day, thank you for helping us all to more than half of our energy.
Thank you, sir. Could you tell me the source of the data used in your pie chart? Thank you